surprisedby perfect overview.
Dynamic LED lighting solutions
Invisua Masterspot 2 Track
Optical Accessories
#gofilter web-app
#gofilter Virtual Tour
Create web-app
Invisua Lightport
Where to buy
Downloads
Invisua Dashboard
Overview - Insight - Control
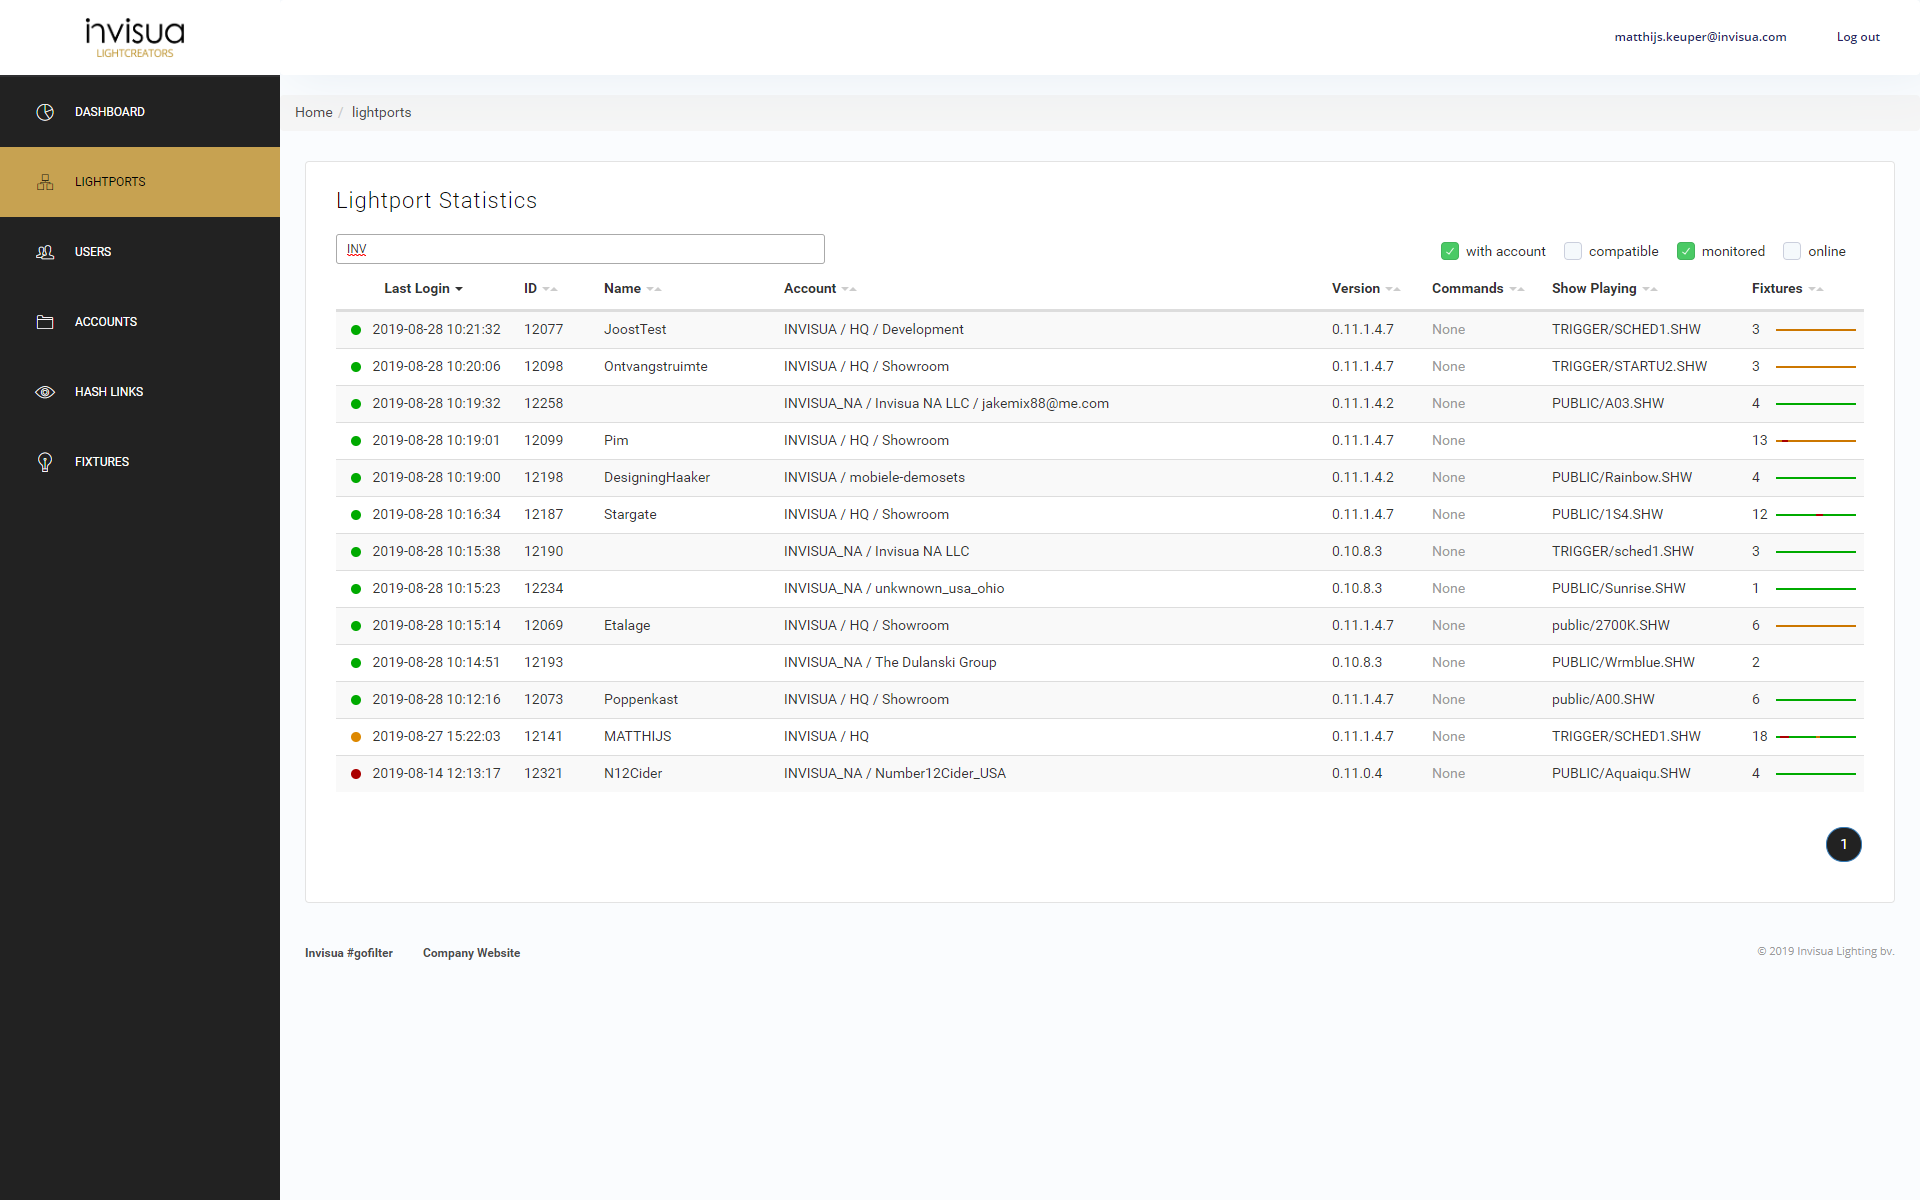
The dashboard of Invisua Lighting gives a glance insight into the performance of the lighting in all your locations worldwide. This tool is essential for, for example, retail chains with shops around the world. The Invisua dashboard gives you a quick overview of all locations, accurate insight into the performance and you can easily control the technical support on site.


Lightport overview
The Invisua Dashboard first shows the performance of all connected Lightports. It shows when the Lightports were last logged on to the server, which light shows are playing and the number of luminaires associated with the Lightport. Of the luminaires, a color bar indicates the performance.

Lightport performance
In more detail, the settings and performance of the individual Lightports can be viewed. A link has also been made to #gofilter. You can switch from the dashboard to #gofilter to adjust or change light shows.
Luminaires performance
From the performance overview of the Lightport it is even possible to retrieve data in respect of the performing of the coupled luminaires. This makes it possible to verify that luminaires that are regularly on orange or red, are out or defective. Technical support can be proactively controlled with this. When light is offered as a service it can be monitored to ensure the agreed quality.


Smart
Account Structure
The Invisua dashboard works with a smart account structure. Each main account can be divided into sub accounts as desired, for example the present locations. Each (sub) account contains Lightports and users. It’s easy to grant rights to each user. At the main account level, it is possible to monitor the overview from, for example, the head Office, distributor or technical service.


